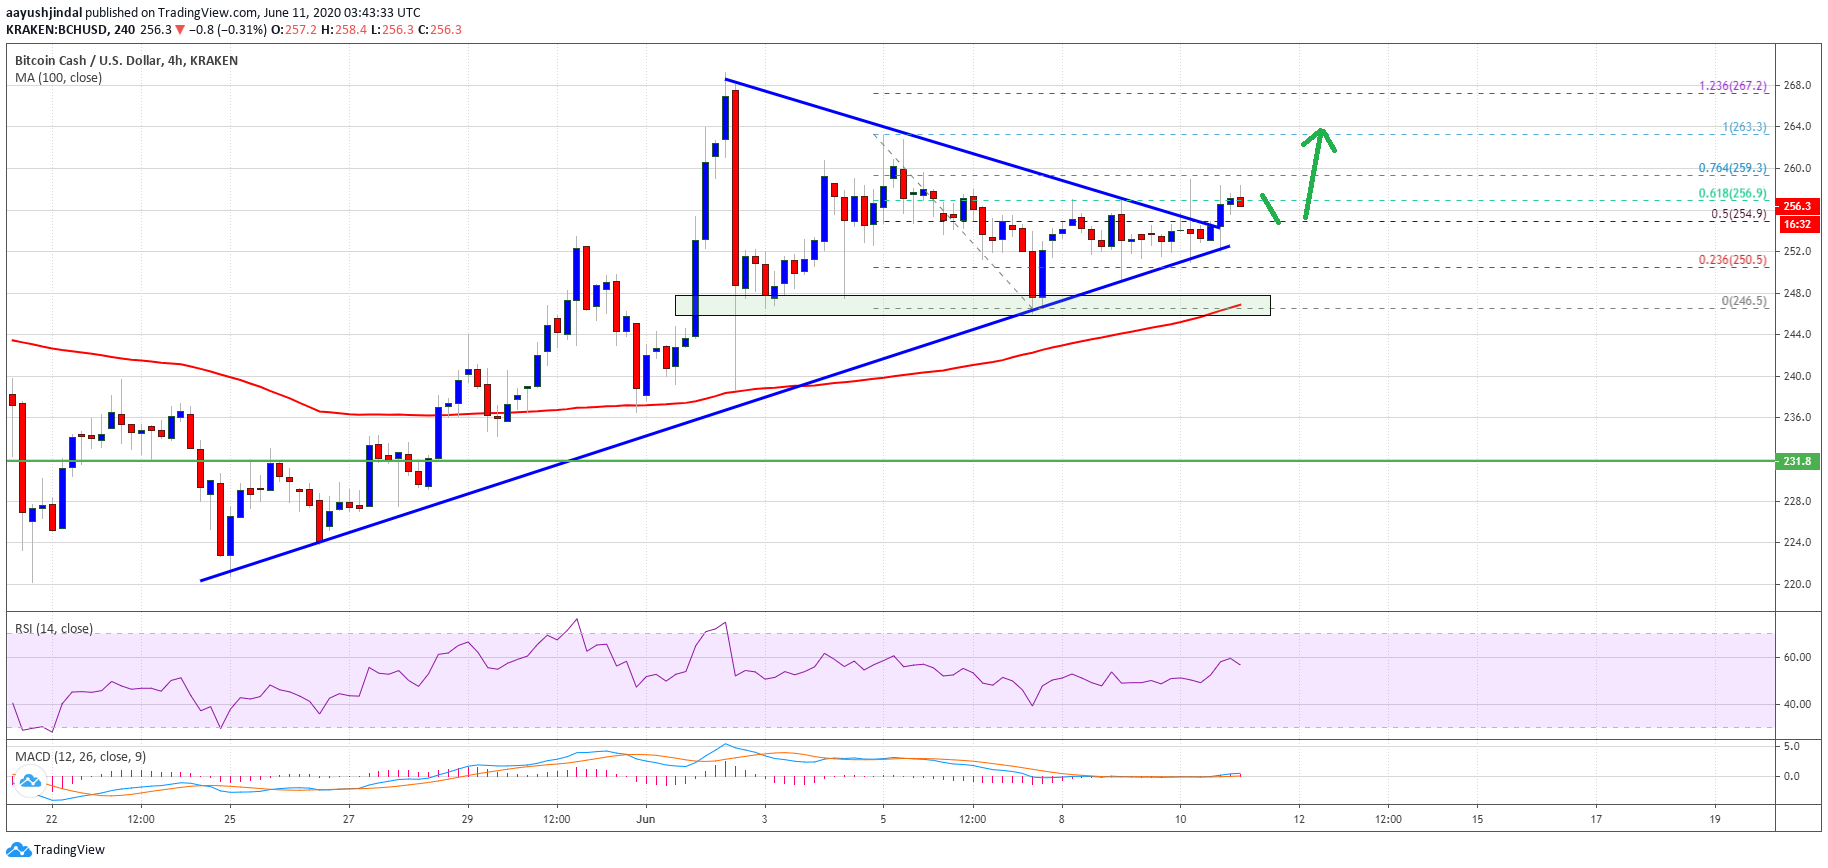
Bitcoin cash price is showing positive signs and it is trading above the $250 support. BCH is likely to continue higher and it might break the $265 and $270 resistance levels.
- Bitcoin cash price is trading in a positive zone above the $250 support against the US Dollar.
- The price broke a crucial hurdle at $255 and it is now showing signs of more gains.
- There was a break above a key contracting triangle with resistance near $255 on the 4-hours chart of the BCH/USD pair (data feed from Kraken).
- The pair is likely to rise steadily towards the $270 and $280 resistance levels in the near term.
Bitcoin Cash Price Signaling Upside Break
After a downside correction, bitcoin cash price found support near the $245 zone. BCH price traded as low as $246 and recently started a fresh increase. It broke the $250 resistance and remained well above the 100 simple moving average (4-hours).
There was a break above the 50% Fib retracement level of the downward move from the $263 high to $246 low. More importantly, there was a break above a key contracting triangle with resistance near $255 on the 4-hours chart of the BCH/USD pair.

The pair is now trading above the 61.8% Fib retracement level of the downward move from the $263 high to $246 low. It seems like bitcoin cash is likely to continue higher above the $260 level.
An initial resistance is near the $268 level or the 1.236 Fib extension level of the downward move from the $263 high to $246 low. If the price breaks the $268 resistance, it is likely to rise further towards the $280 and $285 resistance levels in the near term.
Dips Supported in BCH?
If bitcoin cash price corrects lower in the short term, it might find support near the triangle lower trend line at $252 or $250. The main support is now forming near the $248 zone and the 100 simple moving average (4-hours).
A downside break below the $248 support and a close below the 100 SMA could initiate a sharp decline and the price may perhaps revisit the $230 support zone in the coming sessions.
Technical indicators
Hourly MACD – The MACD for BCH/USD is now slowly gaining pace in the bullish zone.
Hourly RSI (Relative Strength Index) – The RSI for BCH/USD is currently well above the 50 level, with positive signs.
Key Support Levels – $250 and $248.
Key Resistance Levels – $268 and $280.


No comments:
Post a Comment