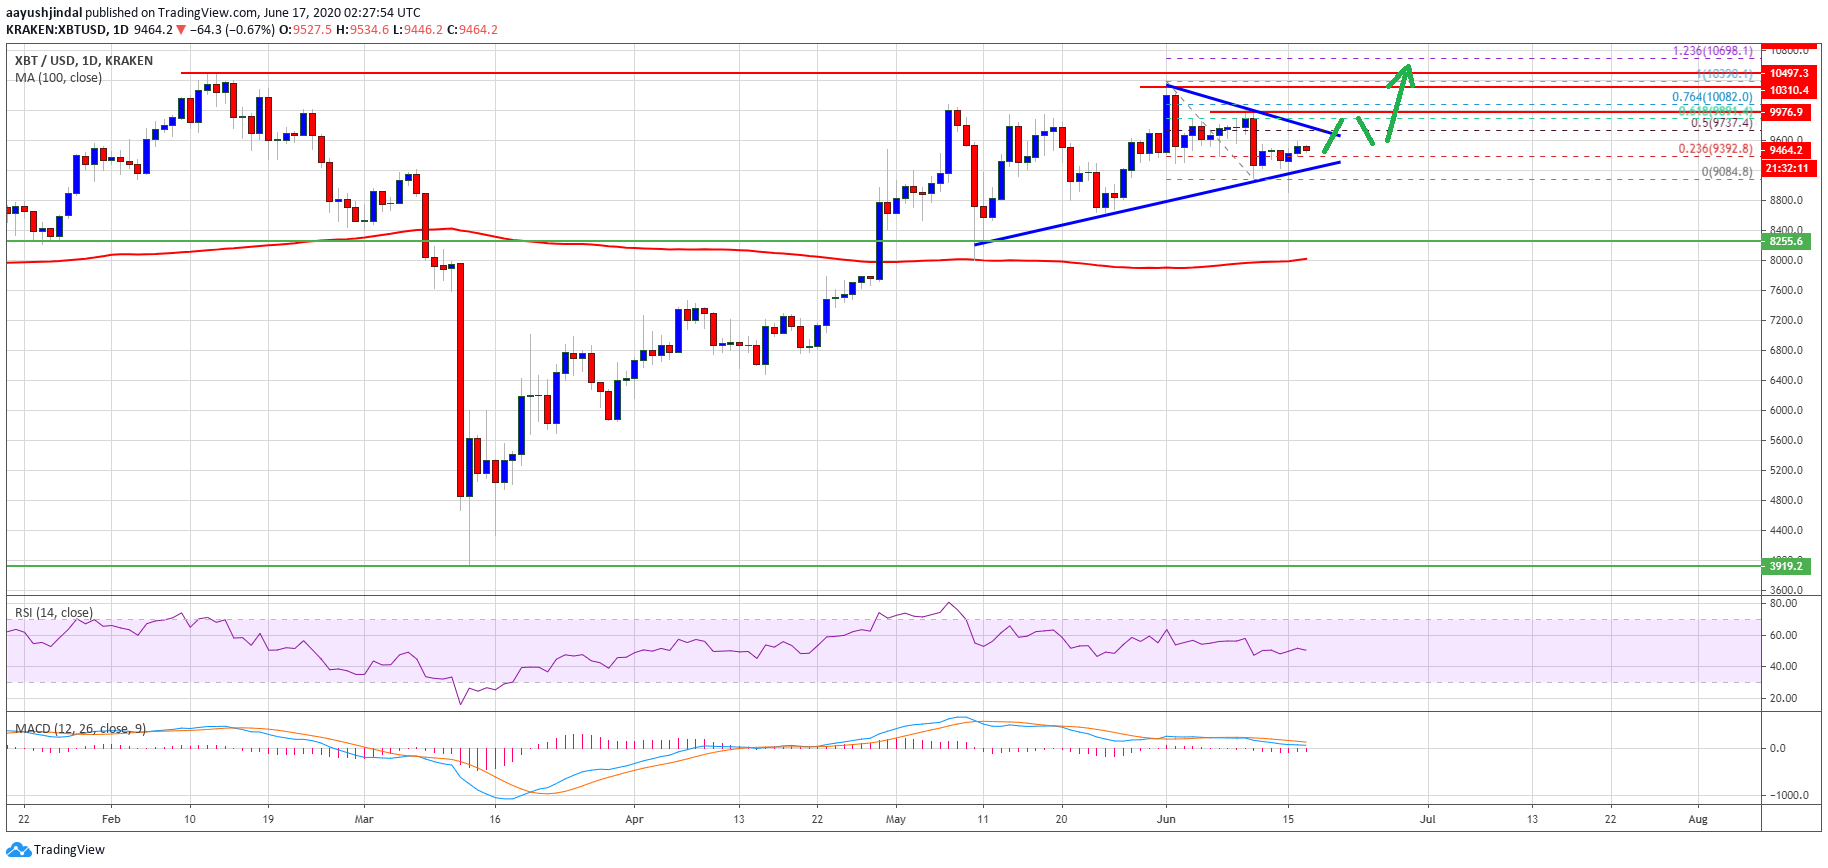
Bitcoin is trading well above key supports on the daily chart against the US Dollar. BTC seems to be preparing for a crucial bullish breakout above the $10,000 resistance zone.
- Bitcoin traded as high as $10,390 before it started a minor downside correction.
- The price is currently trading well above the $9,000 support and the 100-day simple moving average.
- There is a crucial contracting triangle forming with resistance near $9,750 on the daily chart of the BTC/USD pair (data feed from Kraken).
- The pair must break the $9,750 and $10,000 resistance levels to start another increase.
Bitcoin Could Surge Again
Earlier this month, bitcoin price extended its rise above the $10,000 level against the US Dollar. BTC price traded to a new 3-month high at $10,390 and settled well above the 100-day simple moving average.
Recently, there was a downside correction below the $10,000 level. The price broke the $9,500 and $9,300 support levels. However, the price remained well bid near the $9,000 support zone.
Bitcoin is currently recovering and trading well above the $9,300 level. There was a break above the 23.6% Fib retracement level of the downside correction from the $10,390 high to $9,080 swing low.
It seems like there is a crucial contracting triangle forming with resistance near $9,750 on the daily chart of the BTC/USD pair. The triangle resistance is close to the 50% Fib retracement level of the downside correction from the $10,390 high to $9,080 swing low.

Therefore, the price must surpass the $9,750 resistance zone to initiate a fresh increase. The main hurdle is still near the $10,000 level, above which there are high chances of a steady rise towards the $10,500 and $10,800 levels in the near term.
Chances of Bearish Break
If bitcoin struggles to clear the $9,750 resistance, there is a risk of a bearish break. The triangle support is near the $9,300 level. If there is a break and close below $9,300, the price could start a fresh decline.
The first key support is near the $9,000 level, below which the price might extend its decline. The main uptrend support is seen near the $8,250 level and the 100-day simple moving average, where the bulls are likely to take a stand.
Technical indicators:
Daily MACD – The MACD is slowly moving in the bearish zone.
Daily RSI (Relative Strength Index) – The RSI for BTC/USD is just below the 50 level.
Major Support Levels – $9,300 followed by $9,000.
Major Resistance Levels – $9,750, $10,000 and $10,400.
Win 1 Free Bitcoin - Best Free Bitcoin and Allcoin List


No comments:
Post a Comment