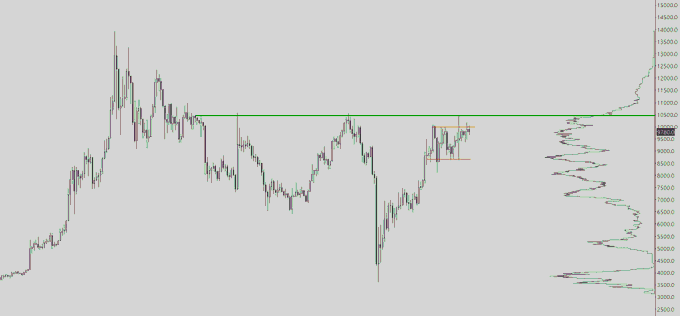
Although Bitcoin has been incessantly swinging between $9,000 and $10,000 over the past few days, the cryptocurrency is technically still in a consolidation pattern.
Ever time BTC attempts to deviate from the range, it is rejected — on both sides. Case in point, when the asset rallied to $10,400 last week, a $1,500 drop followed suit.
An argument has been made that the consolidation is textbook distribution.
One, in fact, likened the recent price action to a textbook schematic first identified by the late technician Richard Wyckoff. This is pertinent as the schematic predicts an imminent 30% correction that will put Bitcoin back into a short-term bear phase.
Yet as BTC continues to press towards the upper end of the range, an analyst is expecting the cryptocurrency to go on a rally that will “melt faces.”
Bitcoin Could Soon See a Face Melting Rally
Prior to the $1,000 drop on Thursday on the back of a crashing S&P 500, a cryptocurrency trader shared the chart below identifying the distribution. “A lot of wicks with no follow-through here,” he wrote in reference to Bitcoin’s inability to establish a trend as it is range-bound.
Although Bitcoin’s $1,000 drop changes the chart slightly, the cryptocurrency is still stuck in the range identified by the analyst.

According to him, this means that should BTC push past $10,000 again, a rally will follow that will “melt faces.”
His chart indicates that above $10,000 — or $10,500 to be exact — is a lack of historical volume according to the Volume Profile indicator. Prices often move rapidly in zones with little historical volume.
$10,500 is also the point at which Bitcoin topped in two rallies over the past year: once in the “Xi Pump” during October 2019 and once earlier this year. This historical importance further accentuates the importance of BTC bulls breaking past this price level.
On-Chain Trends Corroborate The Sentiment
On-chain trends corroborate the sentiment that Bitcoin is about to burst into its next full-blown bull phase.
Ikigai’s senior quantitative analyst Hans Hague explained that BTC is in “heavy accumulation,” which has seen the average holder increase their propensity to “HODL” their coins. Hague shared the below chart, which shows Bitcoin’s price alongside the Adjusted Binary BDD indicator, to illustrate this point.

The analyst added that with more and more Bitcoin investors buying and holding and with block rewards decreasing after the halving, there’s a strong chance BTC will soon see “fireworks.”
Featured Image from Shutterstock
Price tags: xbtusd, btcusd, btcusdt
Bitcoin Price Will "Melt Faces" Next Time It Surges Past $10,000: Here's Why
Win 1 Free Bitcoin - Best Free Bitcoin and Allcoin List

No comments:
Post a Comment